
RETECHNOLOGY PREMIUM MARKETPLACE RELATED PRODUCTS | WEBINARS | SPECIAL OFFERS


You are viewing our site as an Agent, Switch Your View:
Agent | Broker Reset Filters to Default Back to ListProfits on Home Sales Rebound Across U.S. in Second Quarter of 2023 as Housing Market Revives
July 20 2023
Profit Margins on Typical Sales Nationwide Increase Following Three Quarterly Declines; Investment Returns Rise as Median U.S. Home Price Jumps 10 Percent; Seller Profits Still Down Annually Following Earlier Drop-offs
IRVINE, Calif. – July 20, 2023 — ATTOM, a leading curator of land, property, and real estate data, today released its second-quarter 2023 U.S. Home Sales Report, which shows that profit margins on median-priced single-family home and condo sales in the United States increased to 47.7 percent in the second quarter – the first gain in a year.
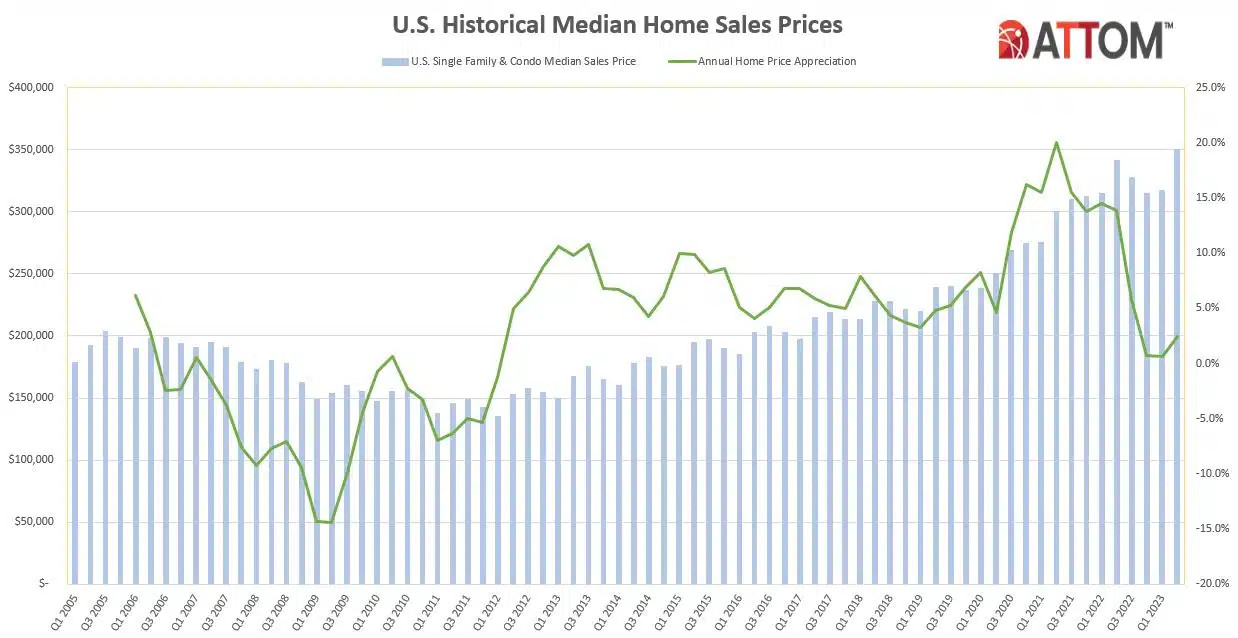
The improvement in typical profit margins, from 43.9 percent in the first quarter of 2023, came amid a rebound in the U.S. housing market that pushed the median nationwide home price up 10 percent quarterly to $350,000. Both the nationwide profit margin and median home price increased after three straight quarterly drop-offs that had begun to reverse a decade-long market boom.
However, even as seller fortunes turned around in the second quarter, the typical investment return nationwide did remain below the recent high point of 53.2 percent, recorded a year earlier during the second quarter of 2022.
"Just when it looked like the housing market was flattening out, prices spiked again, which pushed seller profits back up to nearly their highest level in the past decade," said Rob Barber, CEO for ATTOM. "Stable mortgage rates, an ongoing tight supply of homes for sale and the usual Springtime surge in buyer demand appeared to have combined to halt the downturn we started seeing a year ago. It's way too early to predict another long-term price run-up, especially since buying a home is a financial stretch for so many households around the country. But the second-quarter numbers clearly show the market has more steam left in it, and sellers are reaping the benefits."
Gross profits also shot up from the first to the second quarter of 2023. They rose 17 percent on the typical single-family home and condo sale across the country, to $113,000, although they were still down 5 percent annually.
The about-face in profits and prices around the U.S. during the second quarter reflected a housing market in flux.
After a decade of almost continual increases, home prices dipped across most of the country in the middle of 2022 and continued declining through the first quarter of 2023. The national median price dropped 7 percent during that time as rising home-mortgage rates, high consumer price inflation and a faltering stock market cut into what potential buyers could afford.
Prices and profits went back up in the second quarter during the start of the annual buying season, helped along by several forces. They included the nation's limited supply of homes for sale, mortgage rates that stabilized at around 6.5 percent for a 30-year fixed-rate loan, investment market gains and an easing of inflation. As the 2023 home-buying season continues, the prospect of even better seller profits remains in place but will depend heavily on whether any or all of those factors improve or decline.
Profit margins grow quarterly in two-thirds of U.S. but remain down annually
Typical profit margins – the percent difference between median purchase and resale prices – increased from the first quarter of 2023 to the second quarter of 2023 in 107 (69 percent) of the 156 metropolitan statistical areas around the U.S. with sufficient data to analyze. However, they were still down in 118, or 76 percent, of those metros compared to the second quarter of last year, as the recent improvements were not enough to wipe out losses sustained from the middle of 2022 to the early part of 2023.
Metro areas were included if they had sufficient population and at least 1,000 single-family home and condo sales in the second quarter of 2023.
The biggest quarterly increases in typical profit margins came in the metro areas of Barnstable, MA (margin up from 47 percent in the first quarter of 2023 to 69.2 percent in the second quarter of 2023); Fort Wayne, IN (up from 46.7 percent to 65.5 percent); Augusta, GA (up from 45.7 percent to 64.1 percent); Rochester, NY (up from 50.9 percent to 68 percent) and Charleston, SC (up from 37.7 percent to 52 percent).
Aside from Rochester, the biggest quarterly profit-margin increases in metro areas with a population of at least 1 million in the second quarter of 2023 were in Grand Rapids, MI (return up from 63.9 percent to 76.5 percent); Raleigh, NC (up from 35.8 percent to 47.7 percent), Hartford, CT (up from 38.5 percent to 50.1 percent) and San Diego, CA (up from 45.3 percent to 56.7 percent).
Typical profit margins decreased quarterly in just 49 of the 156 metro areas analyzed (31 percent). The biggest quarterly decreases were in Scranton, PA (margin down from 86.9 percent in the first quarter of 2023 to 70.2 percent in the second quarter of 2023); Hilo, HI (down from 101.5 percent to 86.7 percent); Detroit, MI (down from 90 percent to 76 percent); Spartanburg, SC (down from 60.6 percent to 46.6 percent) and Flint, MI (down from 91.6 percent to 80.5 percent).
Aside from Detroit, the largest quarterly decreases in profit margins among metro areas with a population of at least 1 million came in Pittsburgh, PA (down from 50.9 percent to 40.2 percent); Buffalo, NY (down from 70.9 percent to 61.5 percent); Indianapolis, IN (down from 48.7 percent to 40.4 percent) and Honolulu, HI (down from 47.1 percent to 41.1 percent).
Metro areas with a population of at least 1 million where typical profits remained down the most annually included Austin, TX (margin down from 80.3 percent in the second quarter of 2022 to 47.2 percent in the second quarter of 2023), San Francisco, CA (down from 85.1 percent to 59.4 percent); Phoenix, AZ (down from 75.8 percent to 51.6 percent); Salt Lake City, UT (down from 69.3 percent to 46.4 percent) and Las Vegas, NV (down from 66.5 percent to 46.5 percent).
Raw profits up in almost 90 percent of housing markets
Profits on median-priced home sales nationwide, measured in raw dollars, increased from $96,573 in the first quarter of 2023 to $113,000 in the second quarter, a 17 percent gain. Typical raw profits went up quarterly in 137, or 88 percent, of the metro areas analyzed for this report.
Annually, however, raw profits remained down 4.6 percent from a record high of $118,400 in the second quarter of 2022. They dropped year over year in 65 percent of the markets analyzed.
The biggest quarterly raw-profit increases in areas with a population of at least 1 million were in Birmingham, AL (up 47 percent); Rochester, NY (up 44 percent); St. Louis, MO (up 37 percent); Hartford, CT (up 35 percent) and Cleveland, OH (up 33 percent).
On an annual basis, the largest year-over-year declines in raw profits on median-priced home sales among metros with a population of at least 1 million came in Austin, TX (down 36 percent); Birmingham, AL (down 32 percent); Salt Lake City (down 28 percent); San Francisco, CA (down 27 percent) and Phoenix, AZ (down 27 percent).
The largest raw profits on median-priced sales in the second quarter of 2023 were in San Jose, CA (profit of $600,000); San Francisco, CA ($416,000); San Diego, CA ($301,500); Seattle, WA ($285,000) and Naples, FL ($265,905).
The smallest were in Shreveport, LA ($14,000); Beaumont, TX ($24,943); Rockford, IL ($38,140); McAllen, TX ($41,407) and Toledo, OH ($43,000).
Prices up quarterly in more than 90 percent of nation
Median single-family home and condo prices increased from the first to the second quarter of 2023 in 150 (96 percent) of the 156 metro areas around the country with enough data to analyze and were up annually in 94 of those metros (60 percent).
Nationwide, the median home price rose to $350,000, up 10.4 percent from $317,000 in the first quarter of 2023 and 2.4 percent over the previous record of $341,750, set in the second quarter of last year.
Among metro areas, the biggest increases in median home prices from the first quarter of 2023 to the second quarter of 2023 were in Rochester, NY (up 20 percent); Madison, WI (up 19.1 percent); Bridgeport. CT (up 18.6 percent); St. Louis, MO (up 17 percent) and Augusta, GA (up 16.9 percent).
Aside from Rochester and St. Louis, the largest median-price increases during the second quarter of 2023 in metro areas with a population of at least 1 million were in Detroit, MI (up 15.8 percent); Birmingham, AL (up 15.6 percent) and Grand Rapids, MI (up 14.5 percent).
Home prices tied or hit new highs during the second quarter of 2023 in 89, or 57 percent, of the 156 metro areas in the report. Metro areas with a population of more than 1 million that set or tied records in the second quarter included Chicago, IL; Miami, FL; Dallas, TX; Washington, DC, and Atlanta, GA.
The only metro areas with a population of at least 1 million where the median home price declined from the first to the second quarter of 2023 were Honolulu HI (down 1.4) and Salt Lake City (down .03 percent).
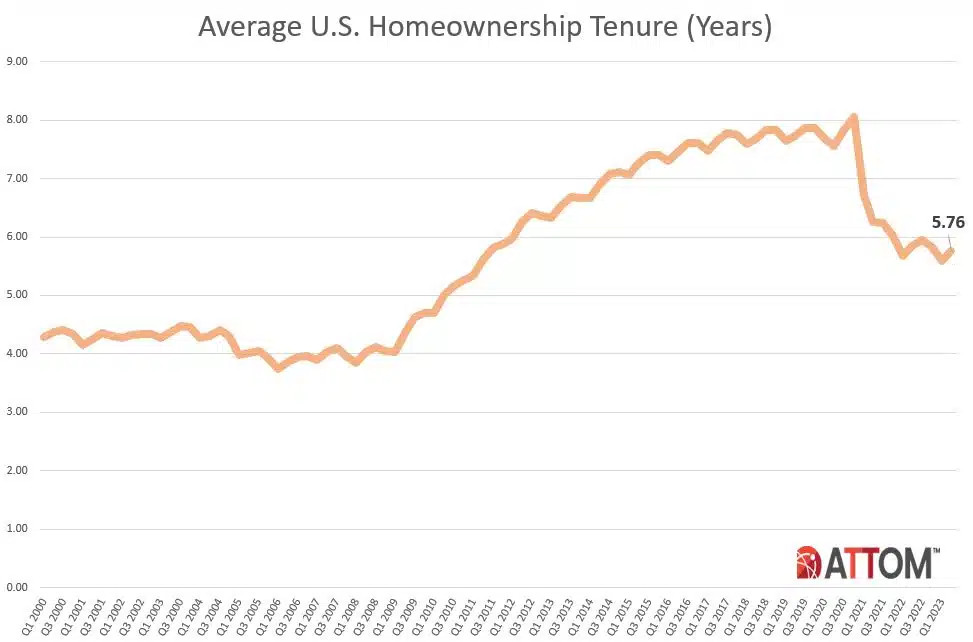
Homeownership tenure inches up after hitting 10-year low
Homeowners who sold in the second quarter of 2023 owned their homes an average of 5.76 years. That was up from a low point over the past decade of 5.59 years in the first quarter of 2023, but still down from 5.84 years in the second quarter of 2022.
Average tenure remained down from the second quarter of 2022 to the same period this year in 47 percent of metro areas with sufficient data. The largest annual declines were in Rockford, IL (tenure down 23 percent); Salem, OR (down 19 percent); Torrington, CT (down 17 percent); St. Louis, MO (down 16 percent) and Manchester, NH (down 15 percent).
All 15 of the longest average tenures among sellers in the second quarter of 2023 were in the Northeast or West regions of the U.S. They were led by Bellingham, WA (8.04 years); Manchester, NH (7.88 years); Honolulu, HI (7.78 years); San Jose, CA (7.38 years) and Bridgeport, CT (7.26 years).
The smallest average tenures among second-quarter sellers were in Lakeland, FL (1.46 years); Memphis, TN (3.23 years); Cleveland, OH (3.88 years); Salem, OR (4.15 years) and Tucson, AZ (4.29 years).
Lender-owned foreclosures dip down close to low since 2000
Home sales following foreclosures by banks and other lenders represented just 1.4 percent, or one of every 69, U.S. single-family home and condo sales in the second quarter of 2023. That was down from 1.7 percent in the first quarter of 2023, although up from 1.1 percent in the second quarter of last year. Still, it remained just a tiny fraction of the 30 percent peak this century hit in 2009 during the aftermath of the Great Recession of 2007.
Among metropolitan statistical areas with sufficient data, those areas where REO sales represented the largest portion of all sales in the second quarter of 2023 included Flint, MI (12.5 percent, or one in nine sales); Albany, NY (6 percent); Lansing, MI (5.9 percent); Detroit, MI (5.2 percent) and Kalamazoo, MI (4.5 percent).
Cash sales drop
Nationwide, all-cash purchases accounted for 35.9 percent of single-family home and condo sales in the second quarter of 2023. That was down from 39 percent in the first quarter of 2023 but was unchanged from the second quarter of last year.
Among metropolitan areas with sufficient cash-sales data, those where cash sales represented the largest share of all transactions in the second quarter of 2023, included Hudson, NY (69.6 percent of all sales); Oneonta, NY (66.7 percent); Wheeling, WV (66.3 percent); Claremont-Lebanon, NH (65.9 percent) and Seneca, SC (63 percent).
Those where cash sales represented the smallest share of all transactions in the second quarter of 2023, included California-Lexington Park, MD (17.4 percent); Vallejo, CA (19 percent); Washington, DC (20.1 percent); Olympia, WA (21.6 percent) and Lincoln, NE (21.7 percent).
Institutional investment increases
Institutional investors nationwide accounted for 6.1 percent, or one of every 16, single-family home and condo purchases in the second quarter of 2023. That was up from 5.7 percent in the first quarter of 2023, but still down from 7.4 percent in the second quarter of 2022.
Among states with enough data to analyze, those with the largest percentages of sales to institutional investors in the second quarter of 2023 were Georgia (9 percent of all sales), Tennessee (9 percent), Indiana (8.4 percent), Oklahoma (8.2 percent) and Texas (8.1 percent).
States with the smallest levels of sales to institutional investors in the second quarter of 2023 included Hawaii (2.4 percent of all sales), New Hampshire (3.1 percent), Rhode Island (3.3 percent), Maine (3.6 percent) and New York (3.7 percent).
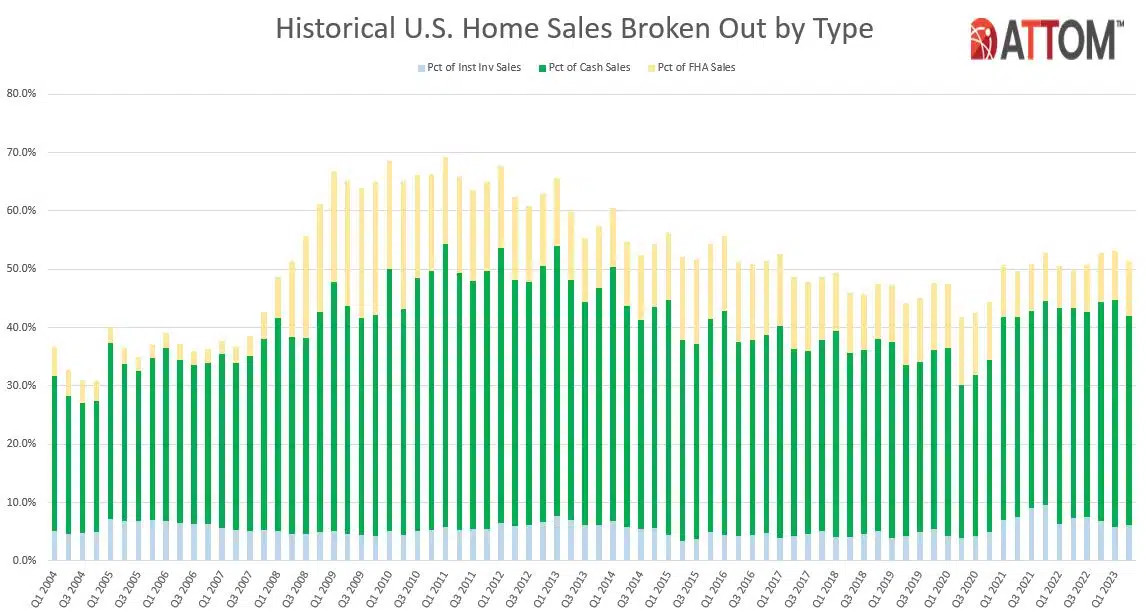
FHA-financed purchases up again
Nationwide, buyers using Federal Housing Administration (FHA) loans comprised 9.4 percent of all single-family home purchases in the second quarter of 2023 (one of every 11). That was up from 8.4 percent in the first quarter of 2023 and from 6.7 percent a year earlier. The latest increase marked the fourth consecutive quarterly gain.
Among metropolitan areas with sufficient FHA-buyer data, those with the highest levels of sales to FHA purchasers in the second quarter of 2023 included Odessa, TX (34.8 percent of all sales); Casper, WY (29.9 percent); El Centro, CA (26.9 percent); Pueblo, CO (22.8 percent) and Dover, DE (22.7 percent).
Report methodology
The ATTOM U.S. Home Sales Report provides percentages of REO sales and all sales that are sold to institutional investors and cash buyers, at the state and metropolitan statistical area. Data is also available at the county and zip code level, upon request. The data is derived from recorded sales deeds, foreclosure filings and loan data. Statistics for previous quarters are revised when each new report is issued as more deed data becomes available.
About ATTOM
ATTOM provides premium property data to power products that improve transparency, innovation, efficiency and disruption in a data-driven economy. ATTOM multi-sources property tax, deed, mortgage, foreclosure, environmental risk, natural hazard, and neighborhood data for more than 155 million U.S. residential and commercial properties covering 99 percent of the nation's population. A rigorous data management process involving more than 20 steps validates, standardizes, and enhances the real estate data collected by ATTOM, assigning each property record with a persistent, unique ID — the ATTOM ID. The 30TB ATTOM Data Warehouse fuels innovation in many industries including mortgage, real estate, insurance, marketing, government and more through flexible data delivery solutions that include bulk file licenses, property data APIs, real estate market trends, property navigator and more. Also, introducing our newest innovative solution, that offers immediate access and streamlines data management – ATTOM Cloud.